In the last 48 years, since 1969, an investor who put $1,000 into the Dow would today have $33,000. That is a gain of 3,200% or 7.6% annually. On the other hand, someone who put $1,000 into gold in 1969 would today have $37,000 or 7.8% annual return. But if you add dividends to the Dow, the return is far superior at 10.7% with the dividends reinvested.
1969 seems like an arbitrary start year but it happens to be the year that I started my first job. No one could of course have predicted any of those returns. The previous 48 years from 1921 to 1969, the Dow only went up 9X but with higher dividends in that period the total return would still have been 10% annually. Gold on the other hand only had one move up during that period from $31 to $45 in 1933 when the dollar was devalued. That is a meagre 1.5X increase. Due to the gold standard, those 48 years had relatively sound money and therefore limited credit creation with the exception of WWII.
Although history can be an excellent teacher, it tells us nothing about the future. Very few would have predicted a 23,000 Dow 48 years ago. So what will happen in the next 48 years. I certainly will not have to worry about that but my children might and my grandchildren certainly will. If I today gave my grandchildren a gift, would it be stocks or gold?
DOW 1,000 NEXT
Buy Silver at Discounted Prices
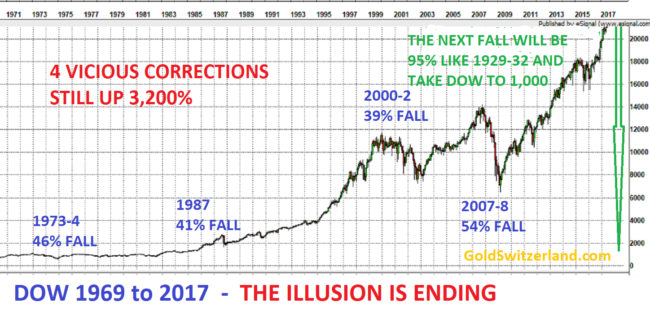
During the last 48 years there were four horrendous drawdowns in the Dow of between 39% and 54%. See chart below. Anyone who was invested in the Nasdaq 2000-02 will most certainly remember the 80% drawdown with many stocks going to zero. Looking 30 years at the 1987 crash for example, I remember that day vividly. I was in Tokyo to list a UK company, Dixons (I was Vice-Chairman), on the Tokyo Stock Exchange. Not the best day for a Japanese listing. It was Monday October 19 and became known as Black Monday. Looking back today on the chart, the 1987 41% collapse looks like a little blip. That is certainly not how it felt at the time, especially since it happened in a matter of days.

In spite of major drawdowns during the 1969 to 2017 period, the long term bull market in the Dow has continued until today when the money invested had multiplied 33X.
 The Big Short: Inside ...
Best Price: $1.49
Buy New $7.99
(as of 02:35 UTC - Details)
Back then in 1969 with the Dow at 700, if someone had said that I would experience the Dow at over 23,000 I would of course had said that’s ridiculous. Had I looked back 48 years from 1969, I would have found a Dow at 80. So the 48 years from 1921 to 1969 the Dow grew just under 9X or 4.5% per annum.
Thus based on history, the Dow should be 9X higher today than in 1969 or 6,300! So how is it possible that we are now seeing a Dow at over 23,000? Well, we have had the Wizards of Fake Money in the meantime who, with their hocus pocus, have created money out of thin air.
DEBT HAS GROWN 2.5X FASTER THAN GDP
Little did I know in 1969 that Nixon two years later would change the destiny of the world for decades to come as the US came off the gold standard. By throwing off the shackles of a gold backed currency, there was no longer anything stopping the US government and the financial system from creating unlimited credit and printing infinite money.
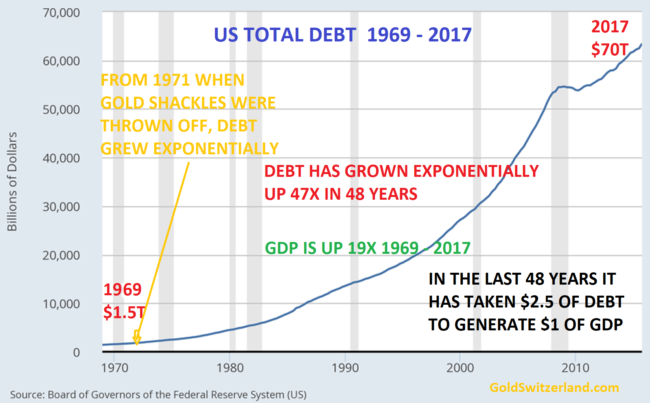
The consequences have been a US and global credit expansion of gigantic proportions. Just in the US, credit has grown 47X from $1.5 trillion to $70 trillion.

As the chart shows, more and more printed money is needed to grow GDP. The US is now running on empty. No wonder that stocks have gone up 33X since 1969. All this manufactured money has not benefitted the real economy. Instead it has gone to the bankers and the 1% elite.
 AmazonBasics Security ...
Buy New $59.99
(as of 08:40 UTC - Details)
 Large The New English ...
Buy New $12.99
(as of 01:25 UTC - Details)
 Amazon.com $50 Gift Ca...
Check Amazon for Pricing.
 Amazon.com Gift Card i...
Buy New $50.00
(as of 03:35 UTC - Details)


