

Yes, indeed. They bought the dip again, nudging the S&P 500 to another “record close”. This time the magic number was 2097 and its represented a tiny gain of 0.3% from the last record close, which was 2090 on December 29th.
Needless to say, there were a lot of thrills and spills in between. As shown below, the broad market index has been staggering upward like a drunken sailor for the last three months. Just about 90 days ago on November 17, in fact, the S&P 500 hit a then record high of 2073 before plunging on five separate occasions by 3-4% toward the 2000 marker during the interim.
So it all adds up to a 1.2% net gain since mid-November. Call it a 4% annualized rate. The question at hand, therefore, is who in their right mind would want to play on the jagged curves shown below for 4% a year?
Indeed, the sharp dips here pictured are not even half the story. The real risk/reward equation is the prospect of gaining perhaps 4% when buying the dips versus a 30-50% bloodbath when comes the next slaughter.
 Flash Boys
Best Price: $1.17
Buy New $5.79
(as of 11:15 UTC - Details)
Flash Boys
Best Price: $1.17
Buy New $5.79
(as of 11:15 UTC - Details)
 ^SPX data by YCharts
The picture above is surely the work of robo-machines and days traders, pivoting sharply and frequently between a narrow corridor of chart points. But that obvious scam does not stop Wall Street from calling the retail sheep, and in that regard they have been more than successful.
The sheep are not only buying the dip, but doing so in the most hazardous, high-beta precincts of the casino. For example, during the last 90 days while the broad market has oscillated forward by just 1.2% on a net basis, the Russell 2000 has been in a sharp uptrend since its mid-October low. Accordingly, it has gained 16% and now sits at an all-time high.
Russell 2000 ETF

IWM data by YCharts
 Dark Pools: The Rise o...
Best Price: $6.32
Buy New $11.74
(as of 06:25 UTC - Details)
Dark Pools: The Rise o...
Best Price: $6.32
Buy New $11.74
(as of 06:25 UTC - Details)
It cannot be said that cheap valuation is what brought the sheep scampering into the Russell 2000 or even the broad market for that matter. The big caps are now trading at 20.4X LTM (latest 12 months) reported earnings, and that in itself is at the tippy-top of the historical range.
In fact, the $102 per share of earnings for the S&P 500 reported for Q4 thus far represent a gain of just 17% from the $87 per share of reported LTM earnings back in Q4 2011. During that interval of tepid earnings advance—-aided by massive stock buybacks with cheap debt and big foreign earnings translation gains owing to a then weak dollar—-there was nothing at all tepid about the S&P 500 index. It began Q4 2011 at 1100, meaning that it was up by 90% at the most recent high.
Can you say multiple expansion? Big time!
Self-evidently, when the stock price index rises 5X faster than per share earnings, the PE multiple must soar. It did—–rising from about 13.5X during the last quarter of 2011 to more than 20X today. Absent the drastic upwelling of animal spirits embodied in the PE expansion, therefore, the S&P index would be at only 1375 today. This implies that upwards of 75% of the stock market gain since late 2011 has been due to multiple expansion alone.
^SPX data by YCharts
 Broken Markets: How Hi...
Best Price: $7.44
Buy New $24.98
(as of 05:40 UTC - Details)
Broken Markets: How Hi...
Best Price: $7.44
Buy New $24.98
(as of 05:40 UTC - Details)
Yet even that cannot hold a candle to the high beta neighborhood were the Russell 2000 stocks dwell. These are all small cap companies with market values well under $5 billion. They are inherently riskier than their big cap counterparts, are preponderantly domestic operations and contain a goodly fraction of names which have highly volatile performance histories or no net profits at all.
But never mind. The index is now trading at nearly 60X LTM reported earnings. So why have the sheep piled back into the Russell 2000 at this kind of nosebleed valuation? Very simply, the old one-two punch of Fed monetary accommodation and Wall Street sell-side propaganda have carried the day.
With respect to the really fast money, there is untold (and unreported) billions available from prime brokers to fund hedge fund positions in the Russell 2000. But even for the slower-footed retail investor, there has never been such a cornucopia of cheap margin debt available to fund speculation in risk assets.
As shown below, margin debt relative to GDP is now at an all-time high of 2.91%. This is nearly 3X the average rate of 1.0% since 1958 and, even more ominously, exceeds the peak ratios registered on the even of the dotcom and subprime busts earlier this century.

So in some substantial part they are buying big cap earnings at 20X and small caps at 60X because the casino has nearly free financing on offer. And its patron gamblers—both professional and home gamers—-are unhesitant to deploy it because of the deeply embedded belief that the Fed has fixed the domestic economy; that the latter has become “decoupled” from the rest of the world; and that the “Yellen” put is no different than the Greenspan or Bernanke variation. Namely, that if the economy does not take-off into “escape velocity” and thereby enable companies to earn-out their current nosebleed valuations, the Fed will continue to douse Wall Street with enough free money to keep the party going and to levitate an ever rising floor under the market.
 The Secret Club That R...
Best Price: $2.23
Buy New $16.87
(as of 09:55 UTC - Details)
The Secret Club That R...
Best Price: $2.23
Buy New $16.87
(as of 09:55 UTC - Details)
Here’s the thing. None of these propositions are true. For the fifth year running it is now evident that there has been no “escape velocity”, and that the 5% GDP expansion printed during Q3 last year was just another head fake. Indeed, the 1.8% gain in real final sales reported for the Q4 in the first estimate is already heading for a significant mark-down owing to the tepid numbers reported for consumptions spending, business investment and trade during the final month of the year.
Moreover, as I demonstrated in a recent post, the inability of the main street economy to attain “escape velocity” owing to “peak debt” was demonstrated once again in the data for December business sales and inventories released by the Census Bureau. And these data are important because they track the entire business economy—–retail, wholesale and manufacturing—-and can be viewed on a trend basis without the noise of seasonal maladjustments.
The story embedded in the December data portrays exactly plodding, naturally recovering economy that exhibits no sign of “escape velocity” or the kind of bounding gains in labor incomes and profits that would be necessary to justify current market valuations.
Thus, total December business sales from all three sectors amounted to $1.4 trillion or a 2.8% gain over the prior year. When converted into “real” terms based on the GDP deflator, business sales were up by 1.9% during the past year.
That’s it—-the same plodding rate of expansion that has been in place since 2009. Moreover, the internals in this week’s report document in spades that monetary policy has lost its potency entirely, and that the $3.5 trillion expansion of the Fed’s balance sheets has done nothing for the main street economy.
The monthly manufacturers sales number for December 2013 had been $480.1 billion, for example, but there was no acceleration whatsoever to be found in the result for the December just ended. That figure was $480.6 billion, meaning no change at all in manufacturers sales during the last year, and an actual shrinkage after adjusting for inflation.
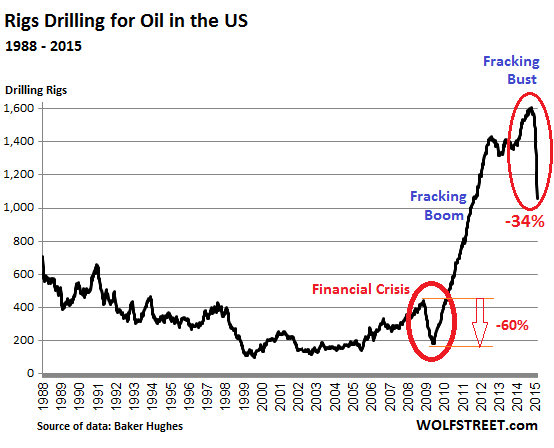
So it is virtually certain that we are heading into another winter swoon in the macroeconomic numbers. The recent thundering crash in oil rig count, for example, is a powerful proxy for business CapEx spending; and it has been the energy sector in general and the shale patch in particular that has accounted for even the timorous gains in fixed business investment since the financial crisis.
As Wolf Richter pointed out earlier this week “….there are only 1056 rigs still drilling for oil, down 443 for the seven reporting weeks so far this year and down 553 – or 34%! – from the peak in October (1,609)….Never before has the rig count plunged this fast this far”.
 The Great Deformation:...
Best Price: $2.00
Buy New $9.95
(as of 09:55 UTC - Details)
Indeed, given the cascading cutbacks in energy and downstream processing of petroleum and most other raw materials, it is virtually certain that CapEx spending will be falling in 2015, along with exports owing to the sharp rise of the dollar and the rapid cooling of the global economy.
The Great Deformation:...
Best Price: $2.00
Buy New $9.95
(as of 09:55 UTC - Details)
Indeed, given the cascading cutbacks in energy and downstream processing of petroleum and most other raw materials, it is virtually certain that CapEx spending will be falling in 2015, along with exports owing to the sharp rise of the dollar and the rapid cooling of the global economy.
Finally, the “decoupling” myth is always trotted out by the Wall Street stock salesmen when all else fails. Yet with each passing month, the very idea of decoupling becomes more fatuous. It is plainly evident that the central banks of the world are lost and desperate. One by one they are resorting to negative interest rates, but not because there is any rational case for more borrowing in a world economy that already labors under $200 trillion of debt.
Instead, we are in the crack-up phase of the two decades long central bank driven credit boom that has literally engulfed the planet. The resulting tidal wave of deflation owing to massive overinvestment and malinvestment in the worlds’ resource, manufacturing, transportation and distribution sectors will drive worldwide prices, profits and wages in a southward direction as excess supply slams up against inadequate demand.
The chart below on the Baltic dry index is not a one-off oddity in the “incoming data.” It is, in fact, the incoming alert that the Wall Street recovery and decoupling stories are completely bogus and that the sheep are once more fixing to join the slaughter.
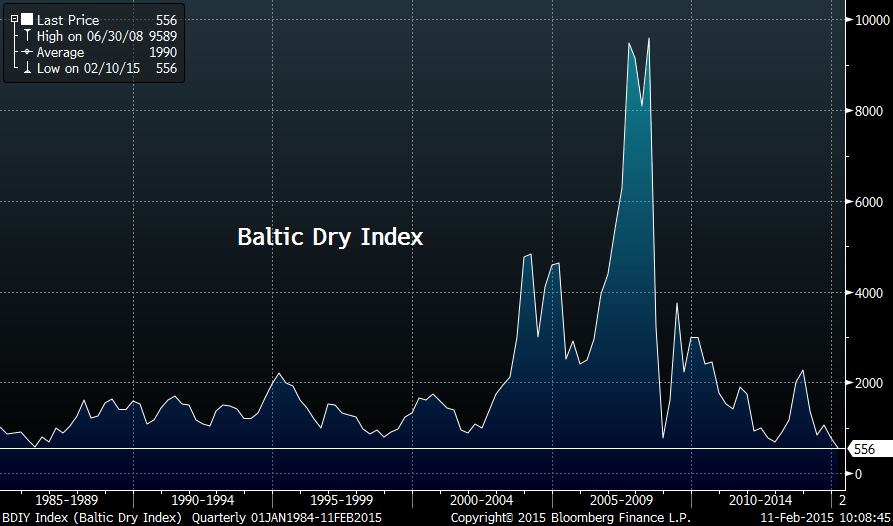
Source: @MktOutPerform
Reprinted with permission from David Stockman’s Corner.

