

For those of you who are short of time and are accustomed to scrolling down to the bottom of an article to read its conclusions I’m going to save you the trouble by putting the conclusions at the start: the broad US stockmarkets are approaching a parabolic blowoff top and should be sold, and gold and silver are bottoming and should be bought. If you have fallen to the floor laughing at this suggestion it is a sign that you have been brainwashed by The Ministry of Disinformation and you are warned to pull yourself together and take the time to calmly consider the hard facts presented below – otherwise you won’t be laughing at all in a few months when YOU will be lying face down in the dirt with tire tracks across your back.
The Barons of Fiat have done an excellent job of discrediting gold and silver and smashing them back down in recent months. They are doubtless crying with laughter at the thought of the distressed “Little Guy” with his modest hoard of coins and featherweight bars, suffering from depression as a result of their actions and turning negative on the sector. The Little Guy’s noble effort to support gold and silver prices by buying a few coins is no match for Big Money’s financial chicanery on the paper market, and when push comes to shove, as happened a month ago, the dumping of a couple of truckloads of gold bars onto the market.
For the Barons of Fiat continually rising gold and silver prices are an embarrassment and may cause people to seriously question the entire fiat system. They don’t want that of course, hence the recent organized takedown, which Big Money even profited from handsomely, by first going short big time, and then getting the media, which they control, to run stories discrediting gold and silver. So it’s nice of Goldman Sachs to tell us that they have now covered their gold short position at a handsome profit.
The underlying drivers for the gold and silver bullmarket remain in place of course, which are unrestrained global money supply growth and credit growth, which are fuelling big inflation in various countries, even if this is disguised by massaged government statistics. This implies that the recent gold and silver takedown is throwing up a major buying opportunity, even if the basing phase continues for a while longer. So let’s now move on to see what the latest charts for gold, and for its COTs and various sentiment indicators are telling us about the internal dynamics of the sector at this point.
In the last update, posted on 28th April, we stated that gold’s relief rally had peaked and that it would turn back down and retreat back towards it April panic lows. The David vs Goliath stories about widespread buying of physical gold around the world enabled Big Money to squeeze a little more blood out of the Little Guy, who jumped back in prematurely, just as we expected. On the latest 9-month gold chart we can see that gold has now reacted back towards its April panic lows as predicted, and our challenge now is to determine whether it will continue to drop to substantially lower levels or whether it will turn up here, or soon, and in our quest we will be greatly assisted by pertinent data on the current COT structure and various sentiment indicators.

Returning to consideration of the 9-month chart we see that gold has dropped back quite hard, but in a fairly steady manner, over the past week or so towards its April panic lows. This alone implies that there is a fair chance that the support at these lows will hold, or that if it is breached, it won’t be by much. As we will soon see, COTs and sentiment indicators strongly suggest that gold is now in a basing process, and that if it does drop further, it won’t be by much.
While gold admittedly doesn’t look too good on its 8-year chart, as the high volume breakdown from the top area implies that it could drop further towards strong support approaching $1000, this outcome does not look likely given the COT and sentiment extremes that we are already seeing, and the explosion of negativity towards the metal in the mainstream media, all of which are indicating that we are at or close to a major bottom NOW.


The COT chart below shows that Commercial short and Large Spec long positions have dropped to their lowest level by far for the life of this chart. This is bullish. Small Specs are out completely, which is another positive sign.


Hulbert Gold Sentiment is at its lowest reading for years. This is a contrarian indicator that is strongly bullish.

The Public Opinion chart for gold below shows that bullishness towards gold is at its lowest level for years, which is another contrarian bullish indication.

The Rydex Fund traders, who are renowned for their incompetence, also furnish us with still more proof that gold is at or close to a major low, as the chart for their holdings below shows their Precious Metals assets at a very low level.

One reason for gold going into the dumpster over the past week or so has been the strength in the dollar. As we can see on the latest 6-month chart for the dollar below, it has broken out upside from its recent Dome formation and gone on a tear, but it is now overbought.

The dollar’s latest COT chart shows that the Commercials now have a substantial short position, and the Large Specs a substantial long position in the dollar, while the Small Specs are record long the dollar, for recent years anyway, and this is viewed as a fairly sure sign that we are at, or close to, a top.

Meanwhile Public Opinion on the dollar is close to its normal upside limit, also making it highly likely that the dollar will top out soon.

Needless to say, if the dollar tops out shortly, gold and silver are likely to take off higher again, and now we are a good point for them to do so.
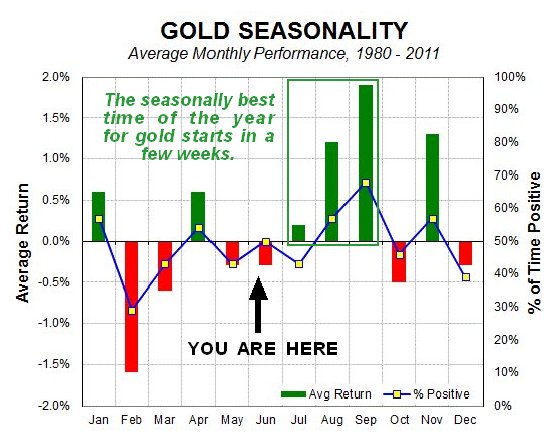
Now, we are aware that if the parabolic acceleration in the broad market intensifies short-term, gold could remain depressed and perhaps drop some more, and this fits with gold’s seasonals. The seasonal chart below shows that gold is seasonally weak in May and June, but starts to perk up in July before entering its seasonally strongest time of the year in August and September. So the base building process in gold may continue for a while yet, during which gold and gold ETFs may be accumulated on weakness.


We will shortly be examining the broad US stockmarket on the site in some detail, with reference to various technical indicators, in an article which will be simply and succinctly titled “FOOLS!!!!”

