


The world has an excess of fiat currency, yet world bankers seem ready to prove that the creation of yet more money will stimulate our economy. The more likely outcome is devalued currencies and a much lower standard of living.
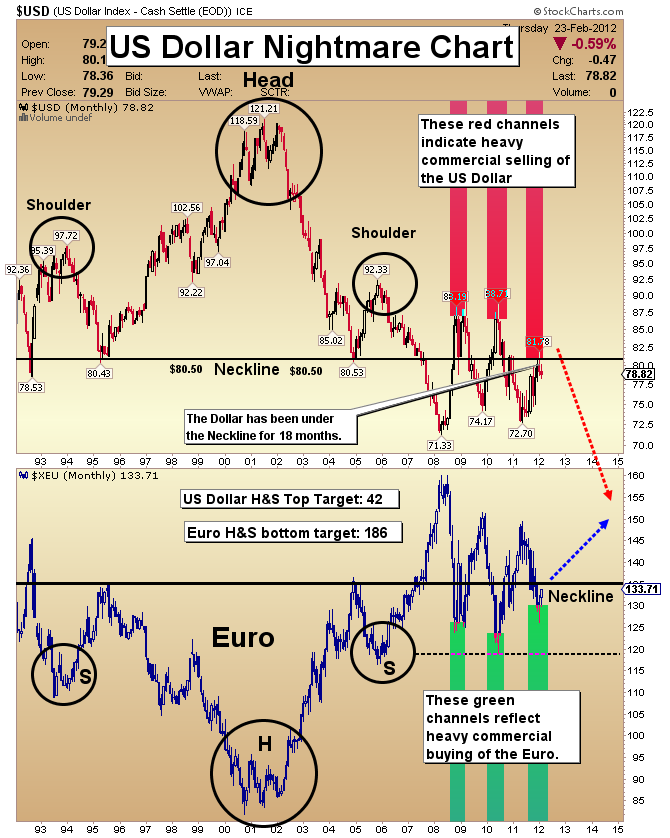
The currency with the most to lose is the US dollar. This week I want you to take a look at this very long term chart, so you can see the precarious technical position of the dollar.
One of the most dependable chart formations used in technical analysis is the head and shoulders pattern. There is a giant head and shoulders top pattern on this very long term dollar chart, and it indicates that the dollar is headed for an enormous decline, and will acquire a downside target of 42.
The dollar has been trading under the neckline of this pattern for 18 months in a range trade. I think the range trade is now ending, and we are on the cusp of a huge new leg to the downside.
US debt is up nearly 50% in four years. The debt will never be repaid in today’s money, because for every dollar that is collected in tax revenue, another dollar is borrowed.
My price and volume analysis suggests that the target price of 42 could be acquired within 2-3 years. A move from about 120 on the dollar index to 80 caused gold to rocket fourfold. Gold went from about $250 to $1000.
A 50% fall in the dollar, with the financial system in this precarious state, could see gold acquire price targets well above $6500.
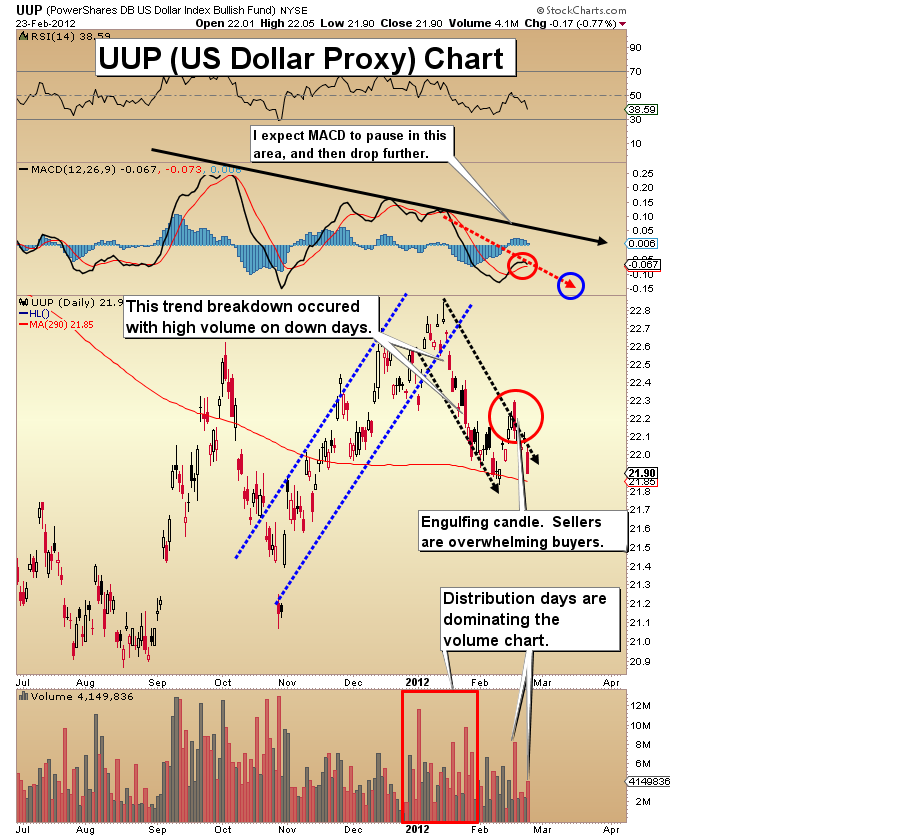
The head and shoulders nightmare chart gives you the big picture of the US dollar. Unfortunately, the shorter term doesn’t look much better. On the above daily chart, you can see the large distribution volume trade and the engulfing candle.
Volume patterns on the UUP chart started to ring my technical alarm bells in December. The move to “new highs” came to anemic volume, warning that the rally was long in the tooth.
The engulfing candle indicates breakout failure. To many it looked like the dollar was prepared to resume trading higher, and then came the ominous engulfing candle on heavy volume.
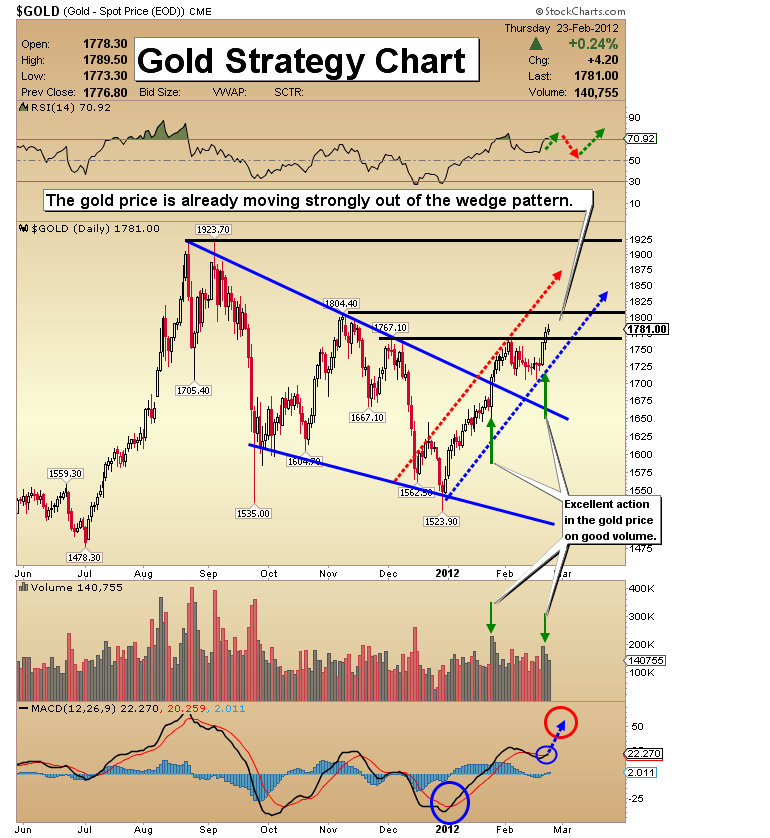
Gold is now making a solid move to the upside, following a textbook breakout. My immediate target zone is $1804 to $1820. Volume analysis is pointing to even higher prices.
Once $1804 has been acquired, gold could move surprisingly quickly to $1900-$1920.
I have been highly impressed with the soft volume that has accompanied each sell-off since the price blasted higher in late January.
I am labeling this move “leg two” of the breakout move, and it is occurring on fuel cell volume. Overall, this gold rally gets an “A Grade” for both its price and volume action.

