


US Dollar Sentiment Extremes Chart
Analysis
Consider the interest rate paid to retired savers today on their bank deposits. The diligent saver gets no respect. They get almost no interest on their money, while the banks receive trillions of dollars through various money printing programs.
The quantitative easing programs have crushed interest rates, and kept them crushed. Investors all around the world have run to the “safety” of the US dollar and US Treasury bonds and bills. These are investments that pay little or no interest.
For even the most prodigious savers, the annual interest paid on savings is not even enough to buy them groceries for the year.
The dollar is “performing” now because European debt is probably also beyond the point of no return, like our debt is, too. That’s not a great reason to buy the dollar.
The US Treasury is pressuring China for a higher Renminbi and a lower dollar. The Treasury likes the term “compete” rather than “devalue”, whenever they talk about taking our national currency to the wood shed.
I have stated for months that the way to take advantage of fiat currency competition (devaluation) is to add to gold bullion positions when the price is negatively affected. The last currency standing will likely always be gold.
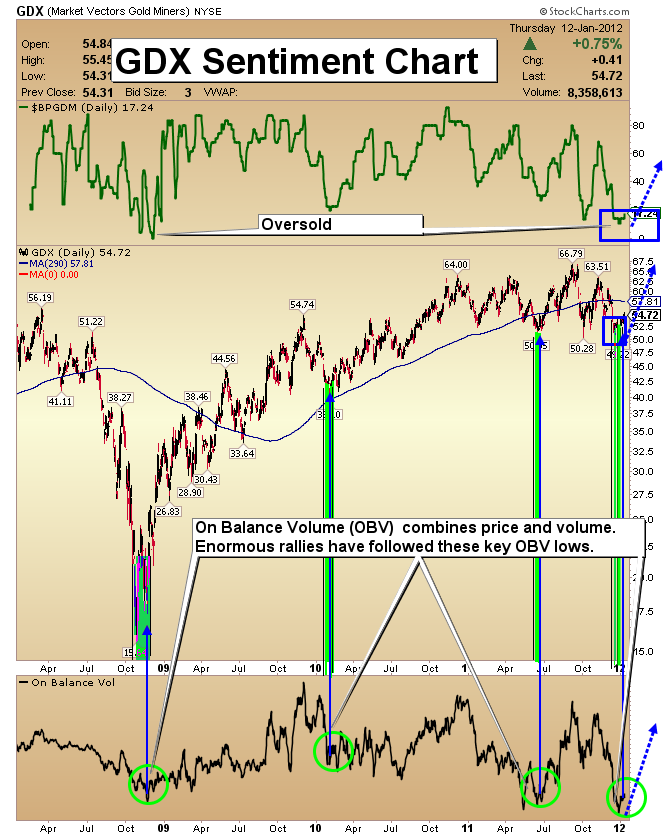
Many investors are convinced that the bottom is falling out of gold, and the gold bull market is finished. The weight of the technical and fundamental evidence suggests they are probably quite premature in making these statements.
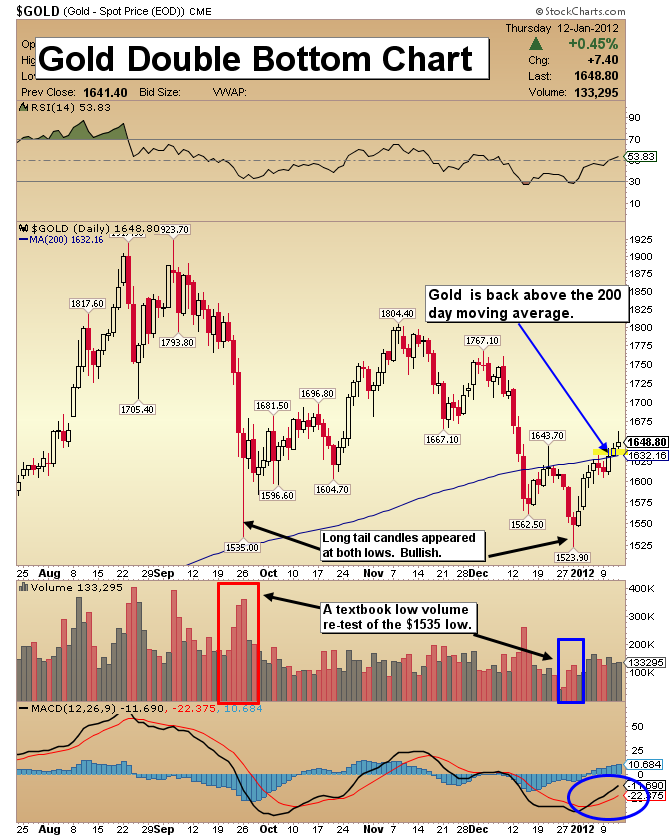
I would argue that gold is undervalued just based on the amount of fiat currency that has been printed over the past few years. Much more money printing is likely to come. Technically, gold is exhibiting a textbook-style double bottom, which is very bullish.
Look at the volume patterns on this chart, and the long-tailed candles that mark each bottom. Gold has also recaptured the 200 day moving average, which is another bullish event.
This chart shows no evidence of a top in gold. Quite the opposite is the case; gold is likely putting in a substantial bottom, and is poised to rise dramatically from this large double bottom formation.
I have two scenarios for gold bullion prices. The first is a run straight to $2300 area by mid-year, with very little correction in the price. The second scenario has gold also rising to $2300, but in December of this year.
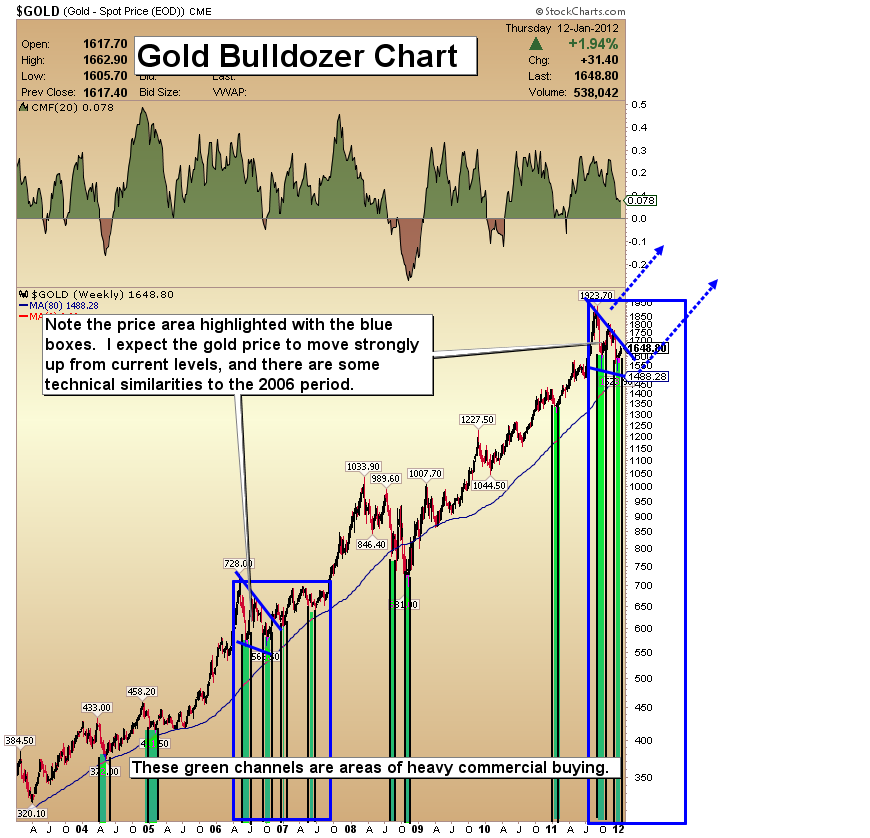
In the short term, it seems likely that gold will trade up to about $1700 on this move. At that point I expect a pullback accompanied by substantial commercial buying, as we have seen on every pullback over the last several months.
In this “gold bulldozer scenario”, gold is likely to perform more like it did after the 2006 low than it did after the 2008 low. After the 2008 low, gold rocketed higher. In 2006, gold first acted more like a bulldozer, plodding steadily higher.
The good news for investors is that both scenarios are bullish, and after the “bulldozing period” that followed the lows of 2006, gold did begin a period of very rapid price appreciation.

