

Bitcoins are a speculative asset. I always examine price charts of any assets I might be considering buying or selling. I’m not going to discuss the fundamentals of bitcoin. The price charts are used in what is called “technical analysis”. The price chart already reflects every possible factor that has influenced trading in the past and every possible expectational factor that has been traded upon to date. Here’s a three-year chart (click on the chart to make it much larger):

This chart shows a “base” that runs from about June of 2011 to early 2013 (exact dates below). It’s the flat-looking part of the price chart. Actually, it’s shaped like a barely-visible cup, which is a basing formation.
The price started at $0.05 on 7/1/2010 and it rose to a local peak of $1.06 on 2/14/2011. A decline occurred. Price fell to $0.67 on 4/5/11. A swift recovery took price to $29.58 on 6/9/11. That was a significant local top. The decline that followed shaped the left side of the cup. Price fell to $2.14 on 11/18/11. The cup base then started to form. This lasted until 2/21/13. On that day, the old high of $29.58 was exceeded when bitcoin closed at $29.68.
A major rise ensued after this breakout. Bitcoin rose to $214.67 on 4/9/13.
Now came a large decline and the formation of a second-stage base. Bitcoin fell to $65.33 on 4/16/13. Another cup formed, and the breakout over the previous high of $214.67 occurred on 11/3/13, when price reached $219.52. This breakout succeeded, as price rose to $1209.94 on 11/30/13, the highest so far. The last price today is $1140.42.
The correct trading strategy, following various sell rules is at this point to SELL bitcoin. First, third-stage bases can and do occur but they are not as reliable as first and second stage bases, simply because by that time the asset has become well-known. Second, when a rise goes vertical, that is a second reason for selling. Third, the size of the advance has way more than fulfilled a projection based upon the nature of the preceding base. Fourth, a daily price rise that is the largest (in dollars not percentages) of the entire advance is a sign of a top. In this case, bitcoin jumped $131.47 on 11/18/13 and $146.76 on 11/21/13. Fifth, there was a one-day break in price on 11/20/13 when price dropped by $143.56. That kind of break suggests distribution. Sixth, the next day price recovery is not good buying or accumulation into strong hands, as it is coming way beyond the price base. No sensible speculator buys so far beyond a base, that being back at $214.67. Seventh, there is a 10-day period in which price advanced from $553.63 to $1209.94. This again shows the vertical price rise. (Most of these sell rules come from William O’Neil, a successful speculator. There can be more analysis of the chart, but this is enough to make the case.)
I know of no way to call a top exactly, or else I’d be very rich. One can shift the odds in one’s favor and locate regions where buys are more advisable than sells and vice versa. I look at charts at all horizons. The shorter-term chart of bitcoin also suggests topping action right now:
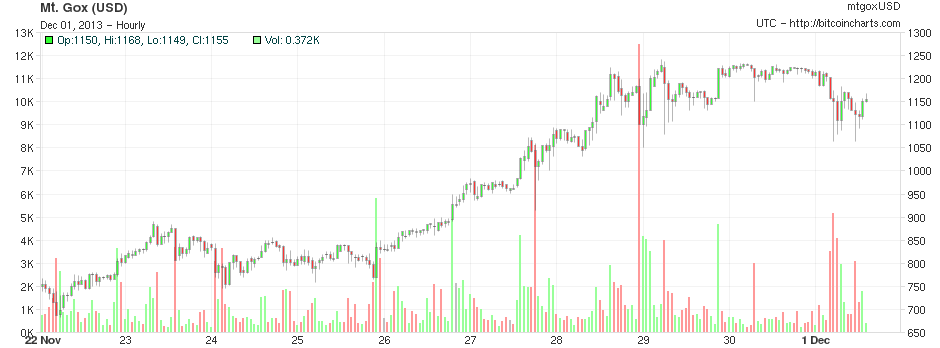
Notice four attempts to go past the $1,200 area significantly and all failed. After that is a rounding over action that is toppy looking. It has held, so far, above the $1,050-$1,100 area. There are a number of down price bars on large volume, suggesting distribution is occurring from stronger to weaker hands.
I personally would not be buying bitcoins with this kind of technical chart action in place. If I held them, which I don’t, holding them is equivalent to buying them. Therefore, I’d be a seller based on the technical analysis. This says nothing about the fundamentals, but they are very, very unlikely to counter the technicals. To do that, a buyer now would have to have information about the value that others do not have. How likely is that? The holders of large amounts of bitcoins are the ones most likely to have such information, and I suspect they are liquidating as much as the market will bear.
UPDATE: This blog was posted at 8:15 a.m., Dec. 1, 2013, and the most recent price was $1140.42. It closed the day at $1004.43.
8:19 am on December 1, 2013
